According to the report "Cities and greenhouse gas emissions: moving forward" by Daniel Hoornweg, Lorraine Sugar and Claudia Lorena Trejos
In Copenhagen in 2009, a coalition of environmental groups presented Canada with an unprecedented third consecutive “Fossil of the Year” award. Canada’s annual per capita production-based GHG emissions are 22.65 tCO2e, among the highest in the world and a 26 per cent increase since 1990, rather than the 6 per cent reduction agreed to in the Kyoto protocol. More than 80 per cent of Canada is urbanized, hence the majority of GHG emissions, if allocated per person, would be apportioned to urban residents ...
Averages emissions vary from a low of 6.4 tCO2e per capita in a central neighbourhood in Toronto to a high of 70.1 tCO2e per capita for an Albertan. There are variations within provinces and cities, and the same person can have different emissions depending on the geographical area used. For example, the same Toronto resident’s per capita emissions are 6.42 tCO2e for their household emissions, 9.5 tCO2e for citywide emissions, 11.6 tCO2e for the Greater Toronto metropolitan area, 16.0 tCO2e as a resident of the province of Ontario and 22.65 tCO2e as an average Canadian.
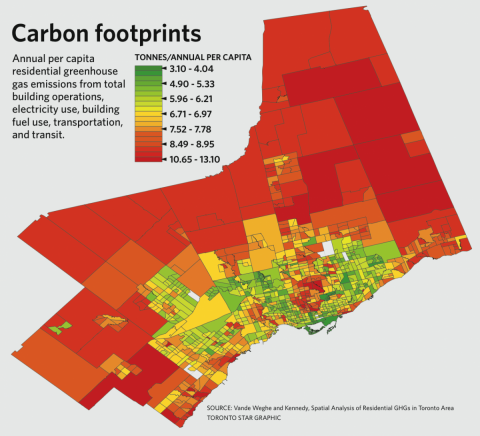
Emissions also vary significantly at the neighbourhood level, as shown in a study by VandeWeghe and Kennedy (see chart below) of consumption-based household emissions and production-based transport emissions by census tract for the city of Toronto. On average, residents in the city core produced 6.42 tCO2e per capita compared to 7.74 tCO2e per capita for residents in the surrounding suburbs. However, there were pockets within the city core that produced emissions as high as those in the suburbs; these census tracts represented wealthy neighbourhoods, characterized by high automobile use and older, inefficient homes. The lowest emissions were 1.31 tCO2e per capita for a dense inner-city neighbourhood with good access to public transportation. The highest emissions were 13.02 tCO2e per capita in a “sprawling” distant suburb.
Here are some numbers from the report for a few neighbourhoods in Toronto and the GTA
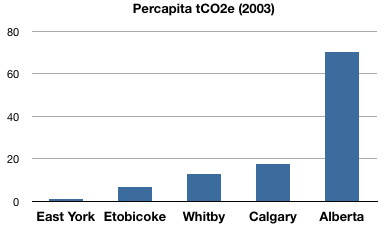
- East York - total 1.31 tCO2e per capita (residential only)
- Etobicoke - total 6.62 tCO2e per capita (residential only)
- Whitby - total 13.02 tCO2e per capita (residential only)
On the other hand, Calgary had emissions of 17.7 tCO2e per capita in 2003 and as noted above, the province of Alberta had 70.1 tCO2e.
The following chart is based on: Vande Weghe and Kennedy, Spatial Analysis of Residential GHGs in Toronto Area
Here is one article and chart on provinces: http://www.cbc.ca/news/canada/saskatchewan/story/2012/08/09/sk-greenhou… and a more local version: http://www.thestar.com/news/gta/2011/02/10/burbs_bigger_greenhouse_gas_…
According to the report "Cities and greenhouse gas emissions: moving forward" by Daniel Hoornweg, Lorraine Sugar and Claudia Lorena Trejos
In Copenhagen in 2009, a coalition of environmental groups presented Canada with an unprecedented third consecutive “Fossil of the Year” award. Canada’s annual per capita production-based GHG emissions are 22.65 tCO2e, among the highest in the world and a 26 per cent increase since 1990, rather than the 6 per cent reduction agreed to in the Kyoto protocol. More than 80 per cent of Canada is urbanized, hence the majority of GHG emissions, if allocated per person, would be apportioned to urban residents ...
Averages emissions vary from a low of 6.4 tCO2e per capita in a central neighbourhood in Toronto to a high of 70.1 tCO2e per capita for an Albertan. There are variations within provinces and cities, and the same person can have different emissions depending on the geographical area used. For example, the same Toronto resident’s per capita emissions are 6.42 tCO2e for their household emissions, 9.5 tCO2e for citywide emissions, 11.6 tCO2e for the Greater Toronto metropolitan area, 16.0 tCO2e as a resident of the province of Ontario and 22.65 tCO2e as an average Canadian.
Emissions also vary significantly at the neighbourhood level, as shown in a study by VandeWeghe and Kennedy of consumption-based household emissions and production-based transport emissions by census tract for the city of Toronto. On average, residents in the city core produced 6.42 tCO2e per capita compared to 7.74 tCO2e per capita for residents in the surrounding suburbs. However, there were pockets within the city core that produced emissions as high as those in the suburbs; these census tracts represented wealthy neighbourhoods, characterized by high automobile use and older, inefficient homes. The lowest emissions were 1.31 tCO2e per capita for a dense inner-city neighbourhood with good access to public transportation. The highest emissions were 13.02 tCO2e per capita in a “sprawling” distant suburb.
Here are some numbers from the report for a few neighbourhoods in Toronto and the GTA.
- East York - total 1.31 tCO2e per capita (residential only)
- Etobicoke - total 6.62 tCO2e per capita (residential only)
- Whitby - total 13.02 tCO2e per capita (residential only)
On the other hand, Calgary had emissions of 17.7 tCO2e per capita in 2003 and as noted above, the province of Alberta had 70.1 tCO2e.