In 2010 Canada's population was 34,126,700. Canada's annual CO2e emissions totalled 688.4 Megatonnes. On average, each Canadian was responsible for 20.2 tonnes of that total. (Note that these emissions are reported in tonnes of CO2e. However sometimes emissions are reported in tonnes of CO2. When all GHGs are included they are expressed in units of CO2e. The CO2e numbers are higher because they include many other GHGs than pure CO2.)
How much do Canada's provinces and territories contribute to the total? How much per-capita and total? Have a look ...
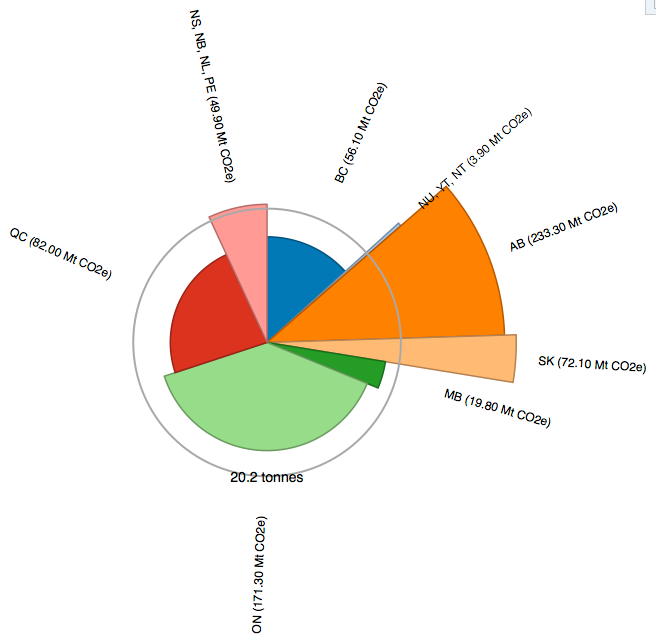
The areas of the wedges, and the numbers beside the province name, represent their total CO2e emissions for 2010. The angle of the wedge represents the population of the province (2010 figures). The radius represents the provincial per-capita emissions.
Notes:
- The grey circle represents average Canadian percapita emissions for the year 2010 (20.2 tonnes).
- As can be seen, Alberta and Saskatchewan have the highest per-capita emissions
- Emission numbers are from Environment Canada (http://www.ec.gc.ca/indicateurs-indicators/default.asp?lang=en&n=BFB1B3…)
- Population numbers are from Statistics Canada (http://www.statcan.gc.ca/tables-tableaux/sum-som/l01/cst01/demo02a-eng…)
Explanation of the wedges
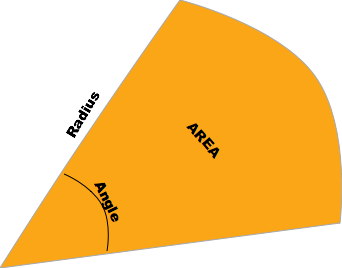 |
The angle of the wedge represents the population. The radius represents the per-capita emissions. (Since the area of a circle is proportional to the square of the radius, in this diagram, the radius is the square root of the per-capita emissions.) The area of the wedge represents total CO2e emissions. |